Sample Report

See the rate, the schedules and the full PDF before you pay — produced for a fictional company by the same calculation customers run.

Every other page on this site describes the output. This one shows it. Below are the real screens and the real document, produced by the same calculation a paying customer runs, for a company we invented.

Northgate Joinery Limited is fictional. Every figure on this page is illustrative. It is not advice, it does not describe a real company, and it must not be used to support an accounting estimate.

We chose the common case rather than a flattering one. It is a ten-year commercial property lease, payable quarterly in advance — the shape of lease most UK SMEs are bringing on balance sheet. The company itself is deliberately unremarkable: £4.2m revenue, a 12.4% EBITDA margin, roughly 1.6× net debt to EBITDA, interest cover near 4×, nine years trading.

The security answer is about the borrowing, not the lease. It is tempting to reason that a tenant renting premises pledges nothing, so the answer is unsecured. That is the wrong question: FRS 102 asks what this company could borrow a similar sum at, over a similar term, and the definition does not mention the lease's own security at all. We answered unsecured here, which assumes Northgate could raise this sum giving nothing. It is the most expensive of the three answers; had we assumed the debenture most UK SME bank facilities carry, the rate would have been materially lower.

The rate, and what sits behind it

The first thing you see is the rate itself, its sensitivity range, and the split between the risk-free base rate and the credit spread. The four pillars underneath show where the spread came from.
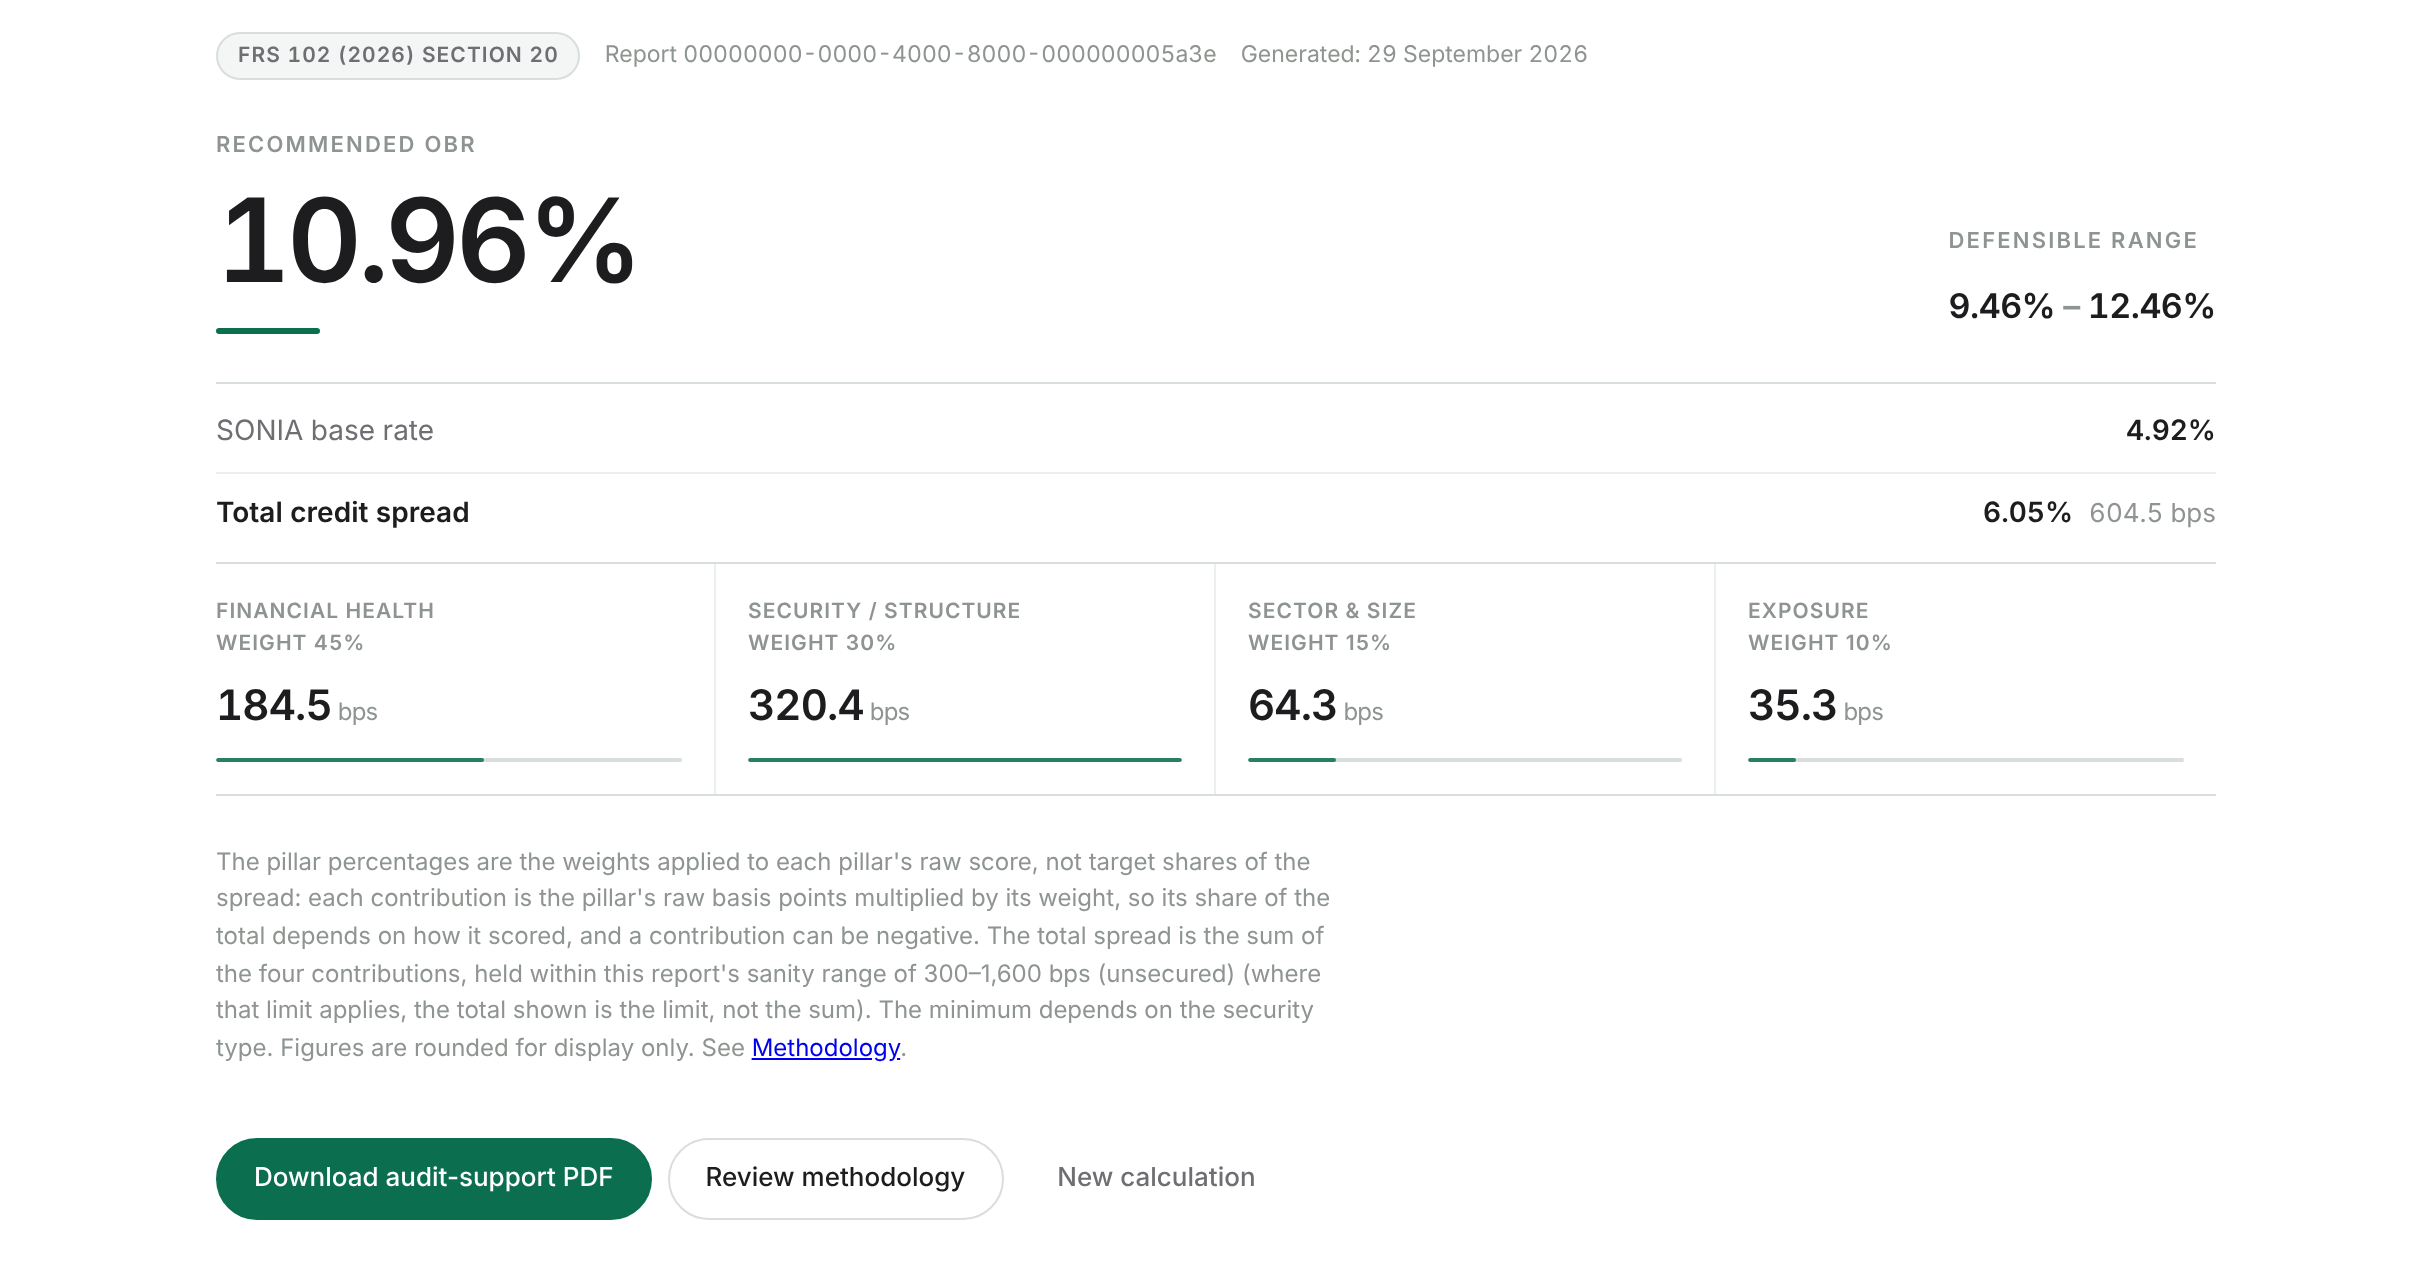
The output page headline: the recommended obtainable borrowing rate in large type, its defensible range, the SONIA base rate and total credit spread below it, and the four pillar contributions in basis points across the foot.

For Northgate the calculation returns 10.96%, with a range of 9.46% to 12.46%: a SONIA base rate of 4.92% for the ten-year term, plus a credit spread of 605 basis points.

That spread breaks down as 184 from the financial pillar, 320 from security and structure, 64 from sector and size, and 35 from exposure. The security figure is doing most of the work, and that is the honest consequence of an unsecured lease: the same company offering a fixed charge over a leased asset prices far lower. A different company, or a different structure, produces different numbers. That is the point of an entity-specific rate.

The entity the rate was calculated for

The report records what it was given. An auditor asking "what was this rate based on?" can read the inputs rather than take them on trust.

The entity summary strip showing the company name, sector, credit size band, security type and lease term used in the calculation.

How the spread is built

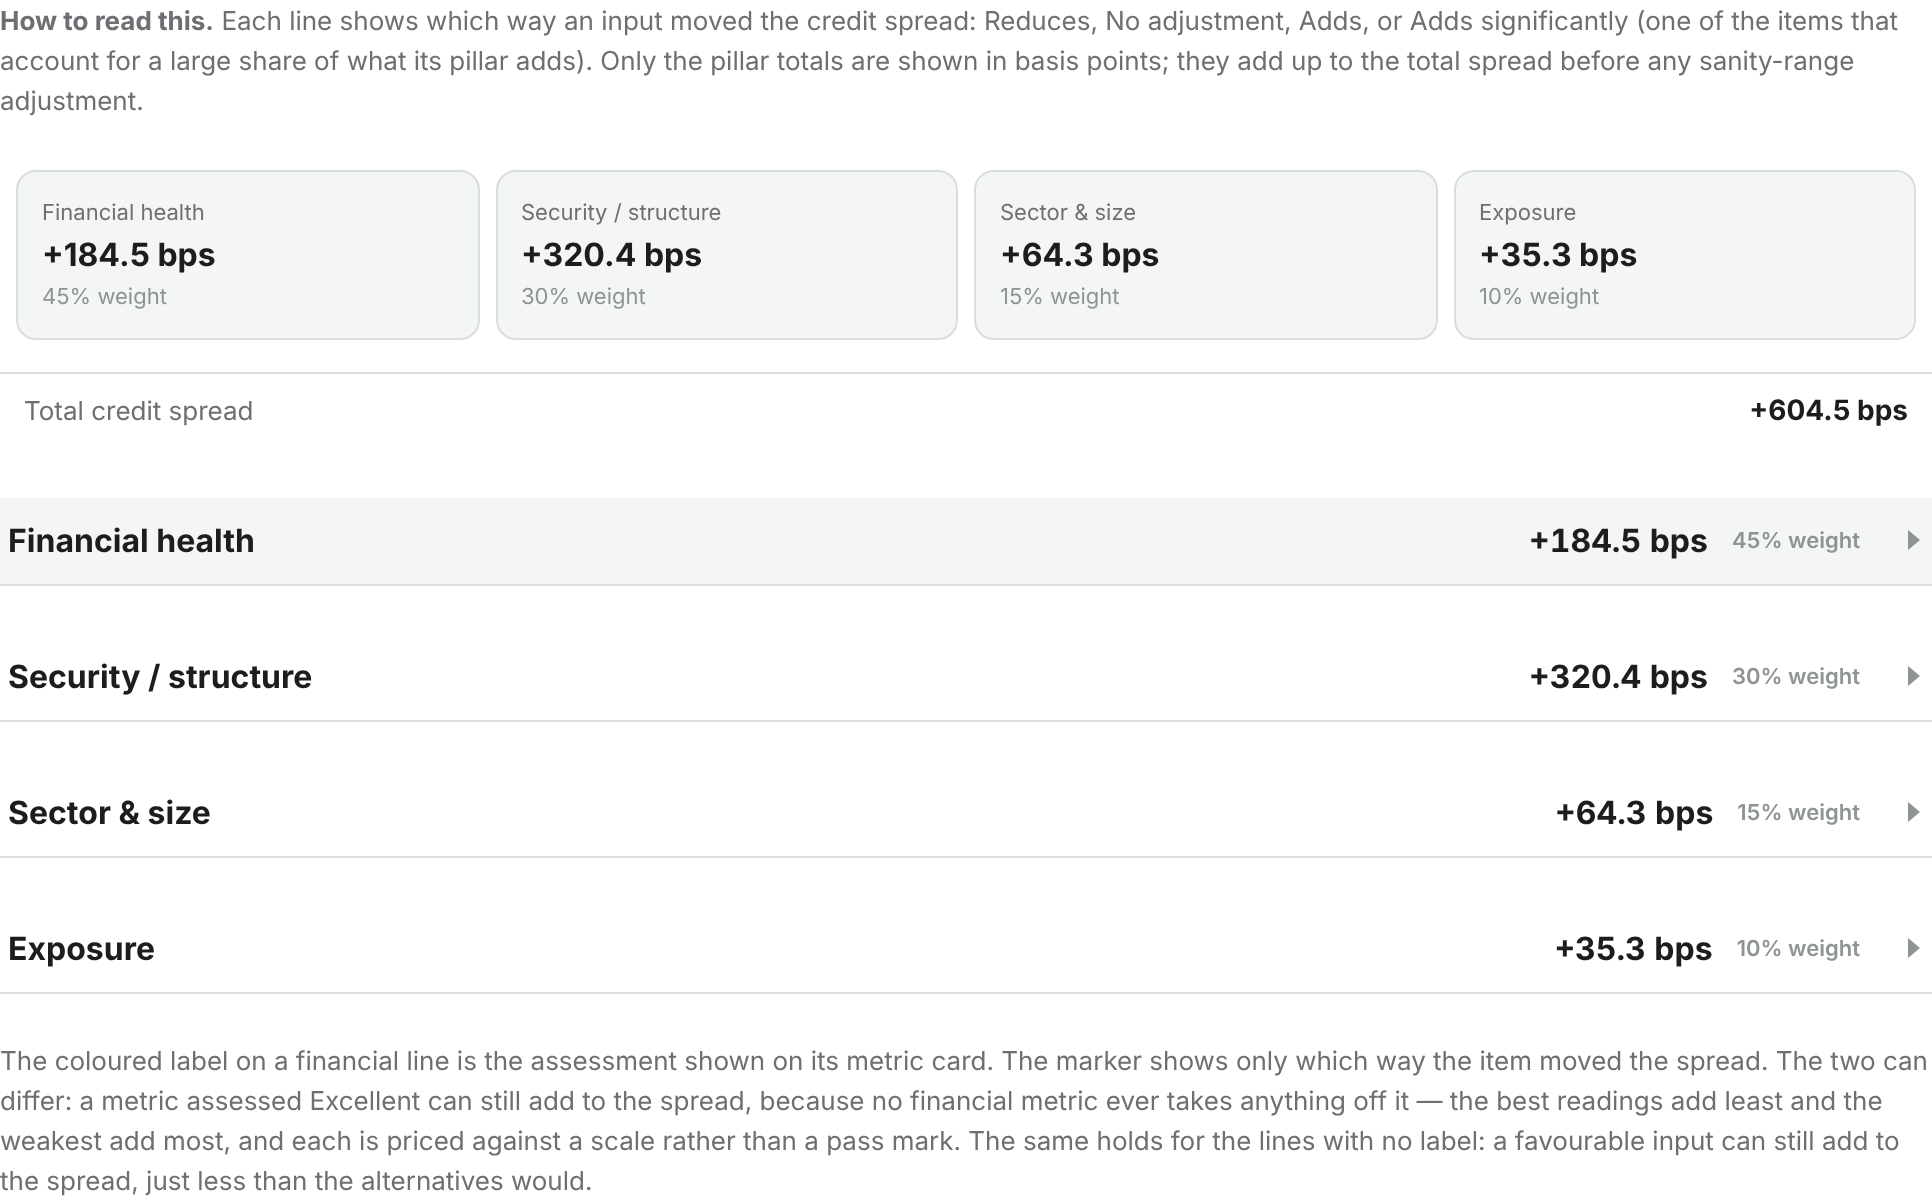
The rate is not a black box. Every input the model priced appears on its own line, showing which way it moved the credit spread — reduces it, leaves it alone, adds to it, or is one of the items doing most of the adding within its pillar.

The spread contribution section, showing the four pillar totals in basis points across the top and, beneath them, each priced input on its own line with a marker and a plain-English direction: reduces, no adjustment, adds, or adds significantly.

The four pillar totals are shown in basis points and add up to the total credit spread. The individual lines show direction only: the weighting behind each one is the part of the model that is ours, and it stays that way.

A financial line also carries the assessment from its metric card. The two can differ — a metric can be assessed Satisfactory and still add to the spread — because every metric is priced against a scale rather than a pass mark.

The accounting outputs

The rate is the start. The lease liability, the right-of-use asset, the balance-sheet and profit-and-loss effects, the journal templates and the draft disclosure wording all follow from it, and all of them are produced for you.

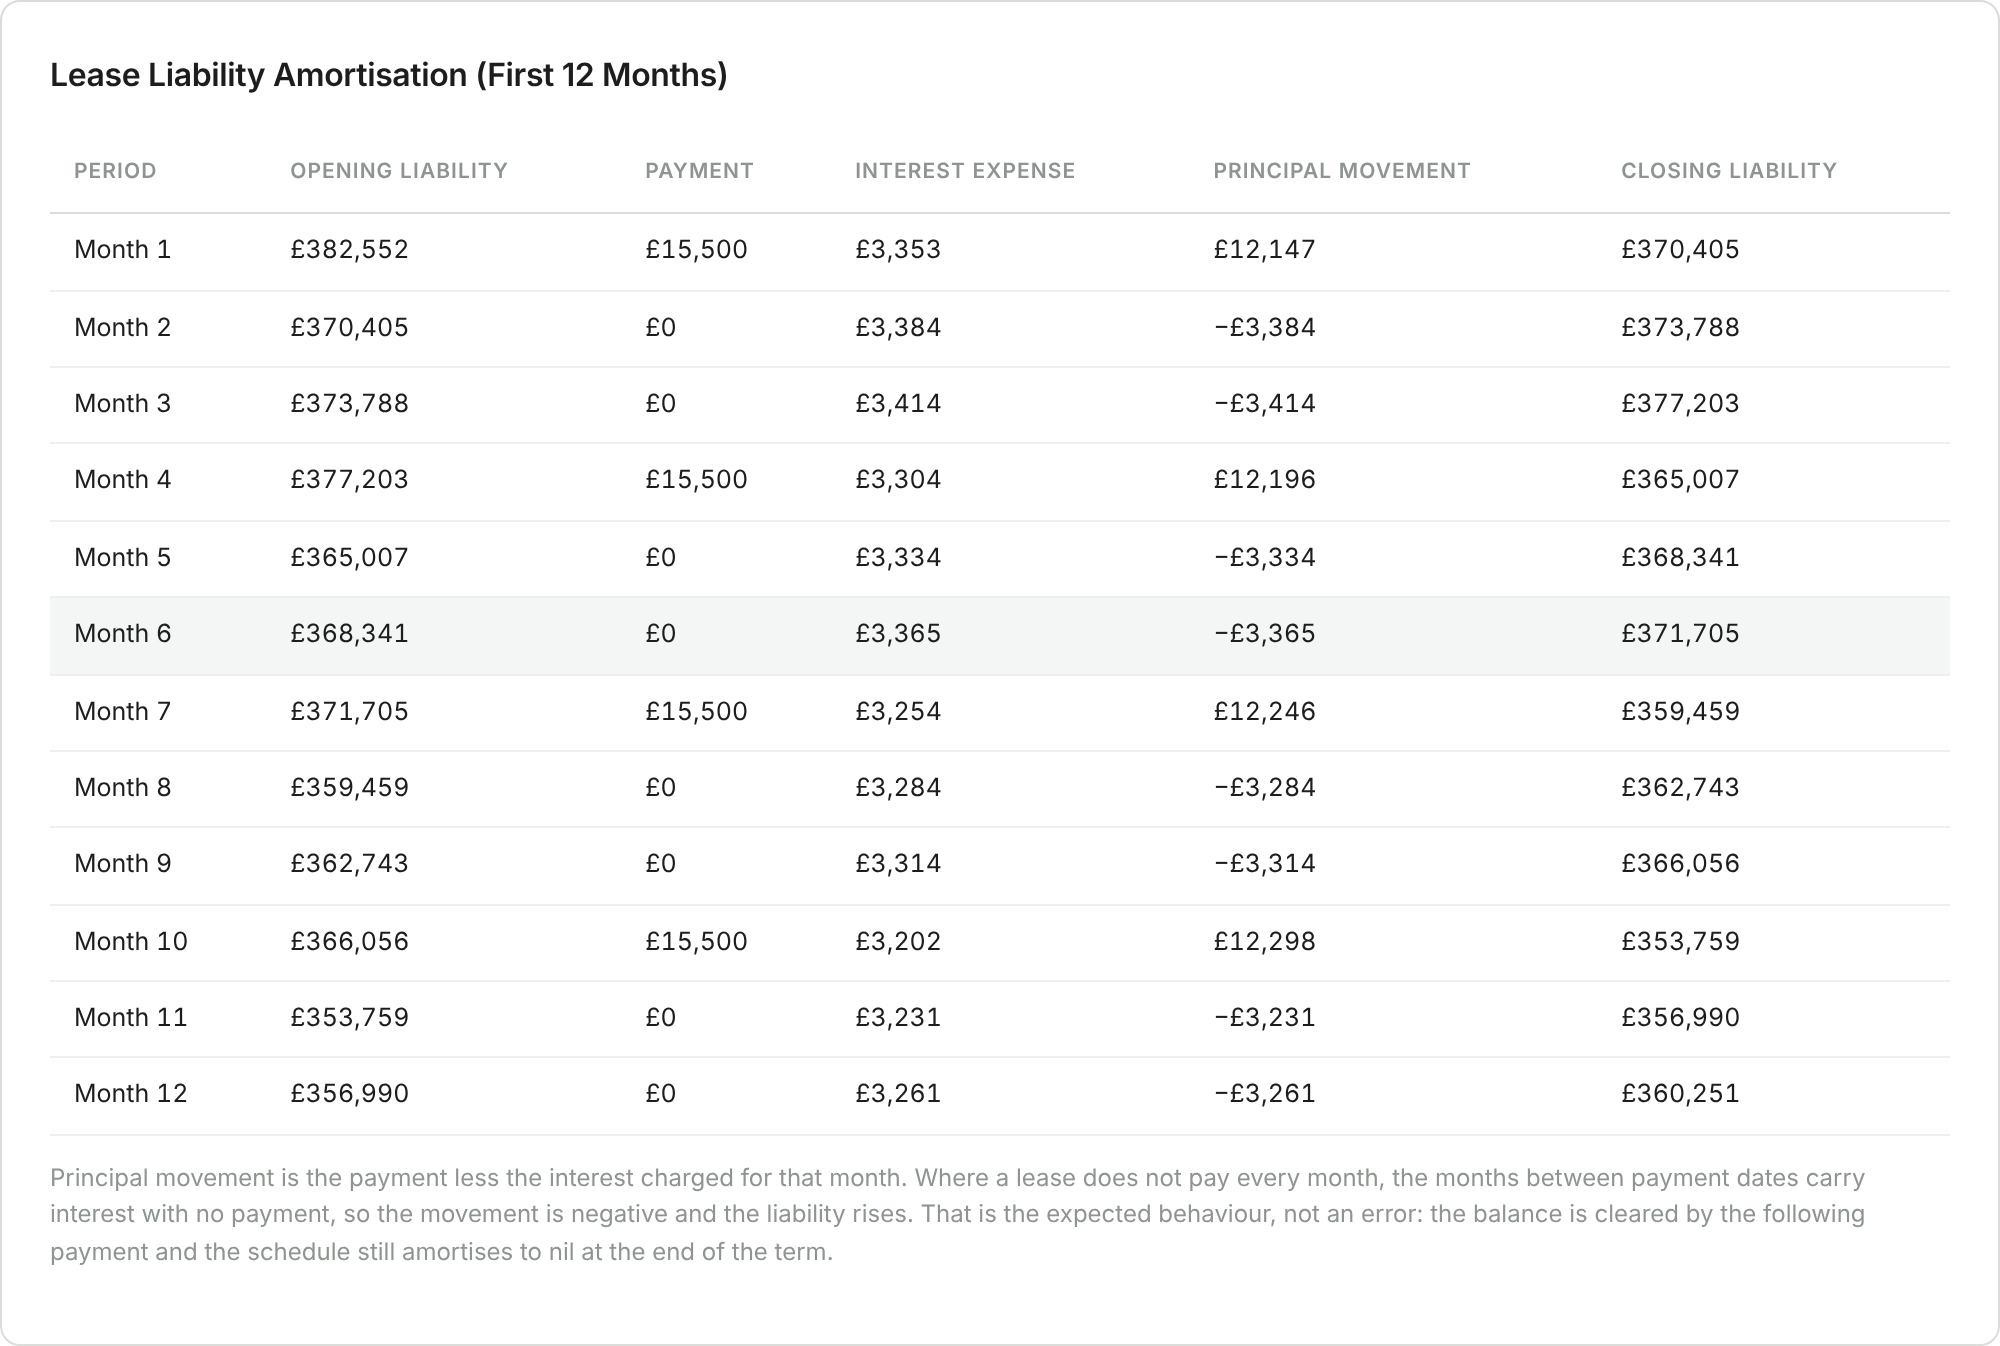
The lease liability amortisation schedule for the first twelve months, showing opening liability, payment, interest expense, principal and closing liability for each month.

The rent is payable quarterly in advance, the usual UK property profile, and the schedule reflects that rather than assuming an even monthly payment.

This is the liability schedule. Five more tabs sit beside it on the same screen, and everything exports to CSV.

The methodology, in the document

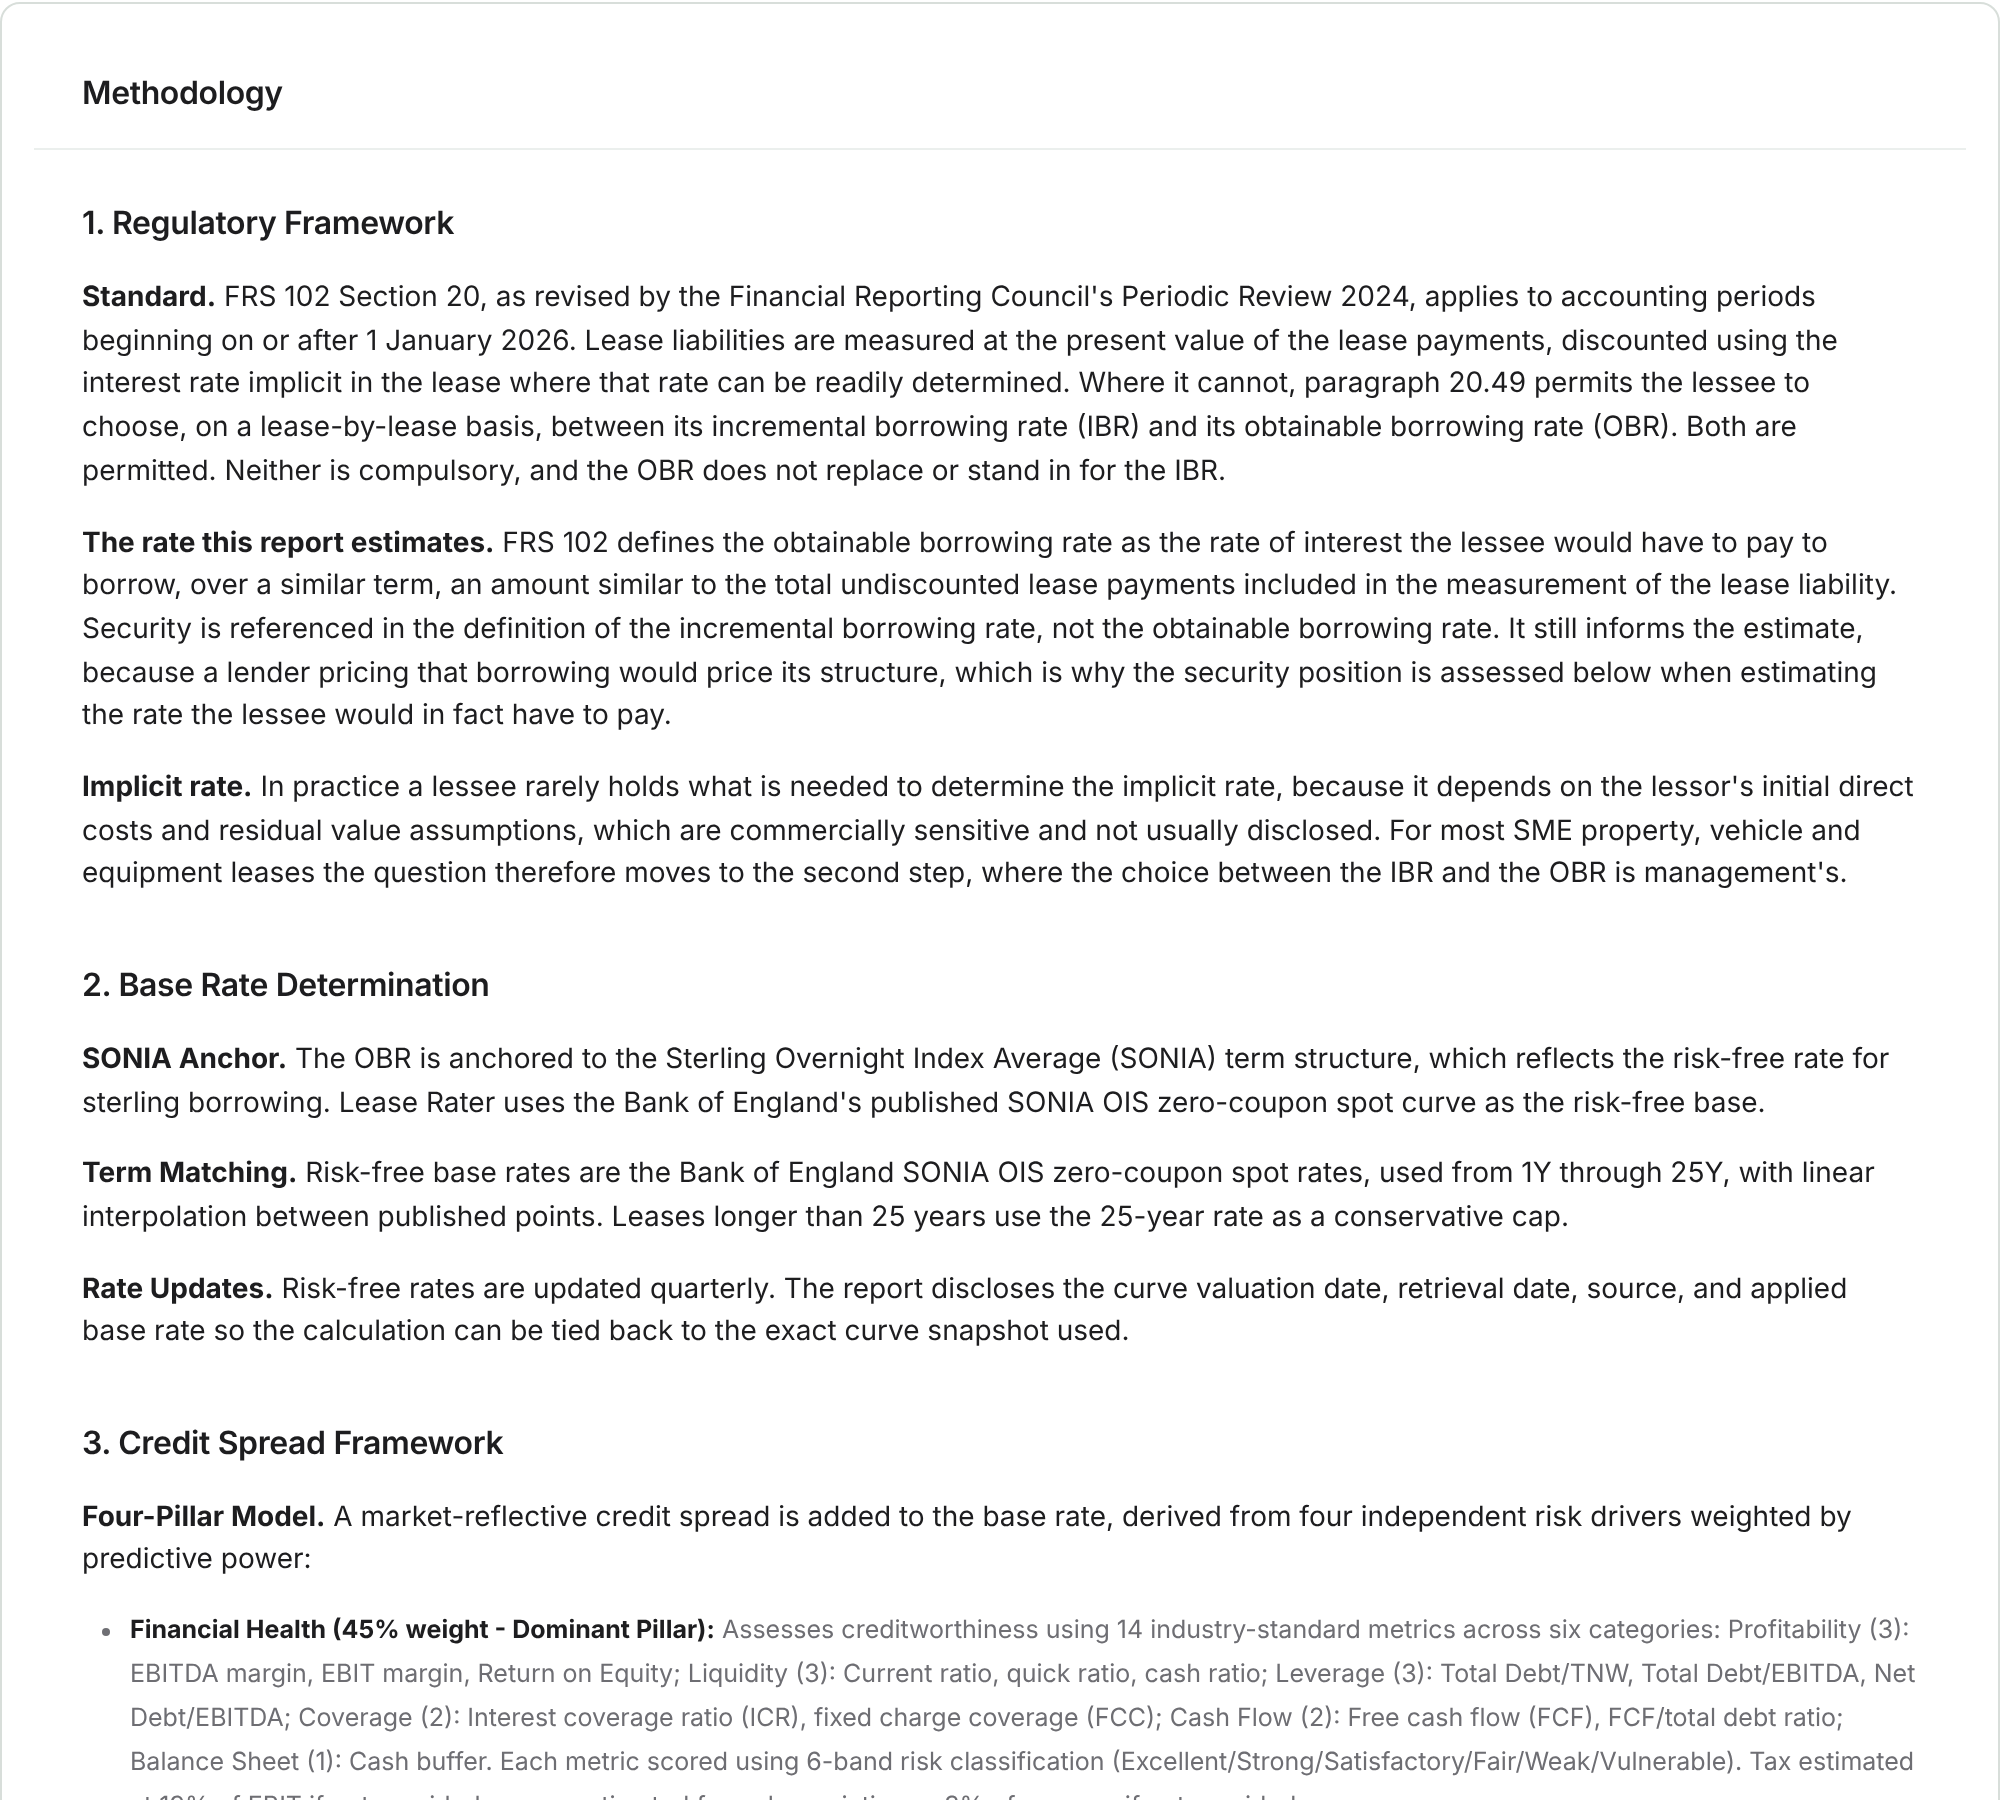
The report states how the rate was derived and cites the paragraph it supports. It is written to be read by someone who was not in the room when the figure was chosen.

The methodology section of the output page, describing how the obtainable borrowing rate was derived.

Download the sample

The PDF below is the whole thing, generated by the same renderer that produces a customer's report, for the same fictional company. It carries a banner on its cover saying so.

Download the sample report (PDF)

What is inside it:

  • The rate and its range, with the base rate and credit spread shown separately.
  • Fourteen financial metrics, each with its value, the risk band it fell into, and the formula used.
  • The four pillars and what each contributed.
  • The accounting schedules: lease liability, right-of-use asset, balance sheet, profit and loss.
  • Journal templates and draft disclosure wording.
  • Rate metadata: which SONIA curve was used, when it was published, and the compounding convention.
  • A glossary distinguishing the rate implicit in the lease, the incremental borrowing rate and the obtainable borrowing rate.

What this is and is not

Lease Rater produces an estimate and the documentation supporting it. It does not decide anything for you, and it is not a substitute for your own judgement or your auditor's.

  • The figure is an estimate, which is why it is presented with a range rather than as a single number.
  • You choose the rate you use. Under FRS 102 Section 20 the lessee chooses, lease by lease, between the incremental borrowing rate and the obtainable borrowing rate where the rate implicit in the lease cannot be readily determined.
  • The basis-point calibrations and the band thresholds are not published. The structure is, on the methodology page; the calibration behind it is not.
  • We charge the same fee whatever rate comes out. Nothing about the fee depends on the answer.

Run your own calculation See pricing